July 2026
Maple in Slack, alerts rebuilt on one engine, a documented v2 API with an Alchemy provider, PlanetScale, and spend limits.
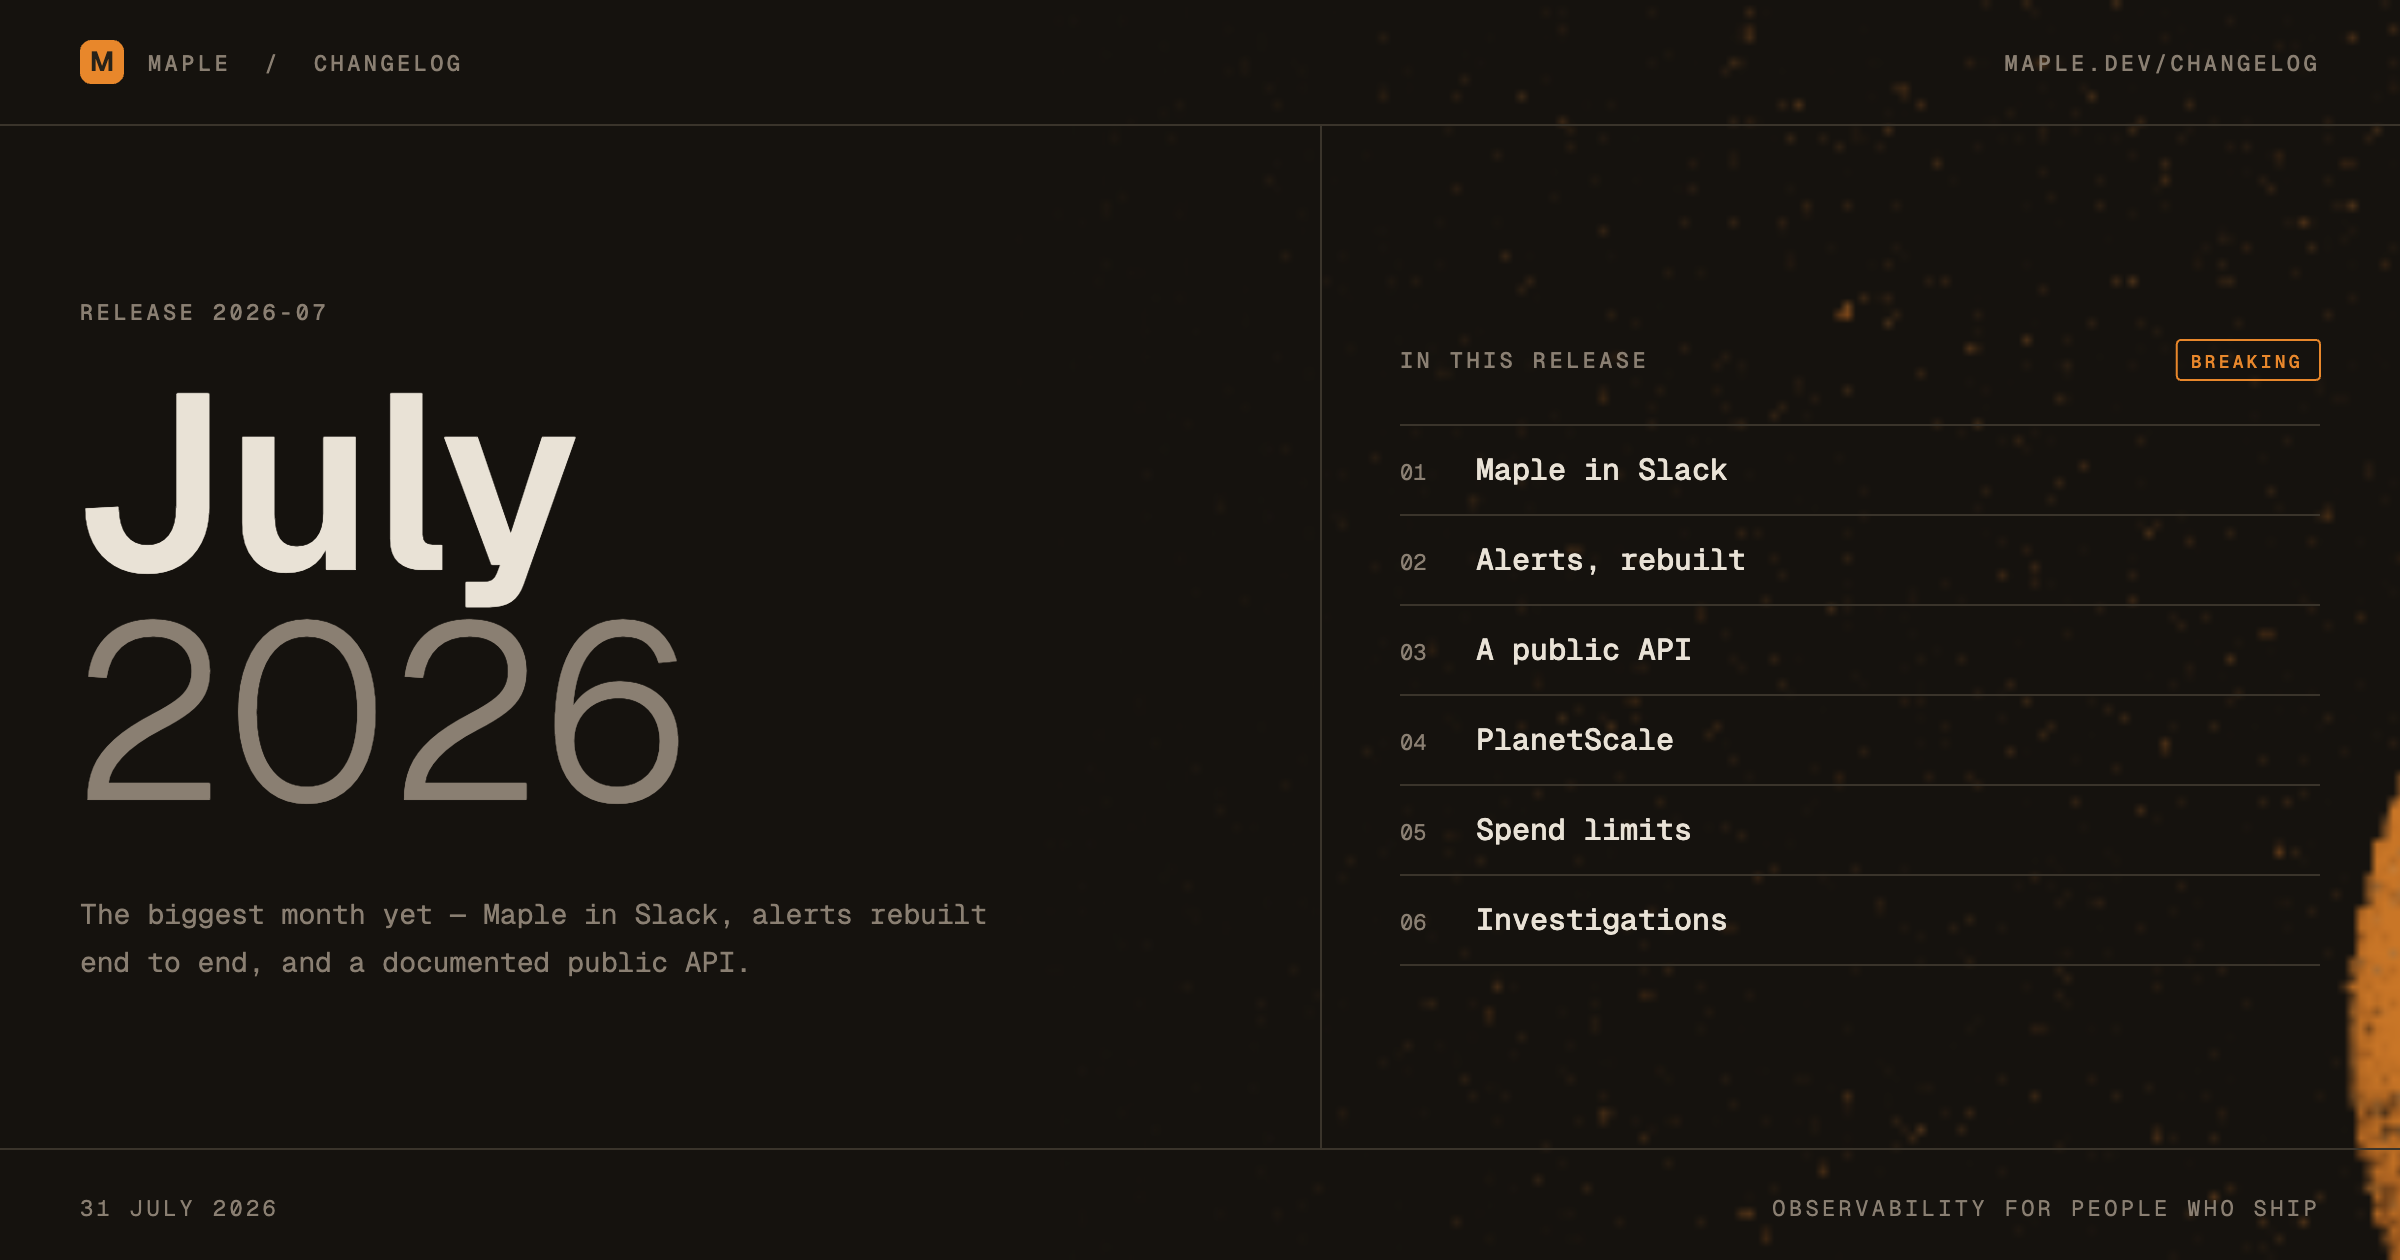
Maple is in Slack now, alerts were rebuilt on one engine, and there’s a documented public API you can drive from code.
Maple in Slack
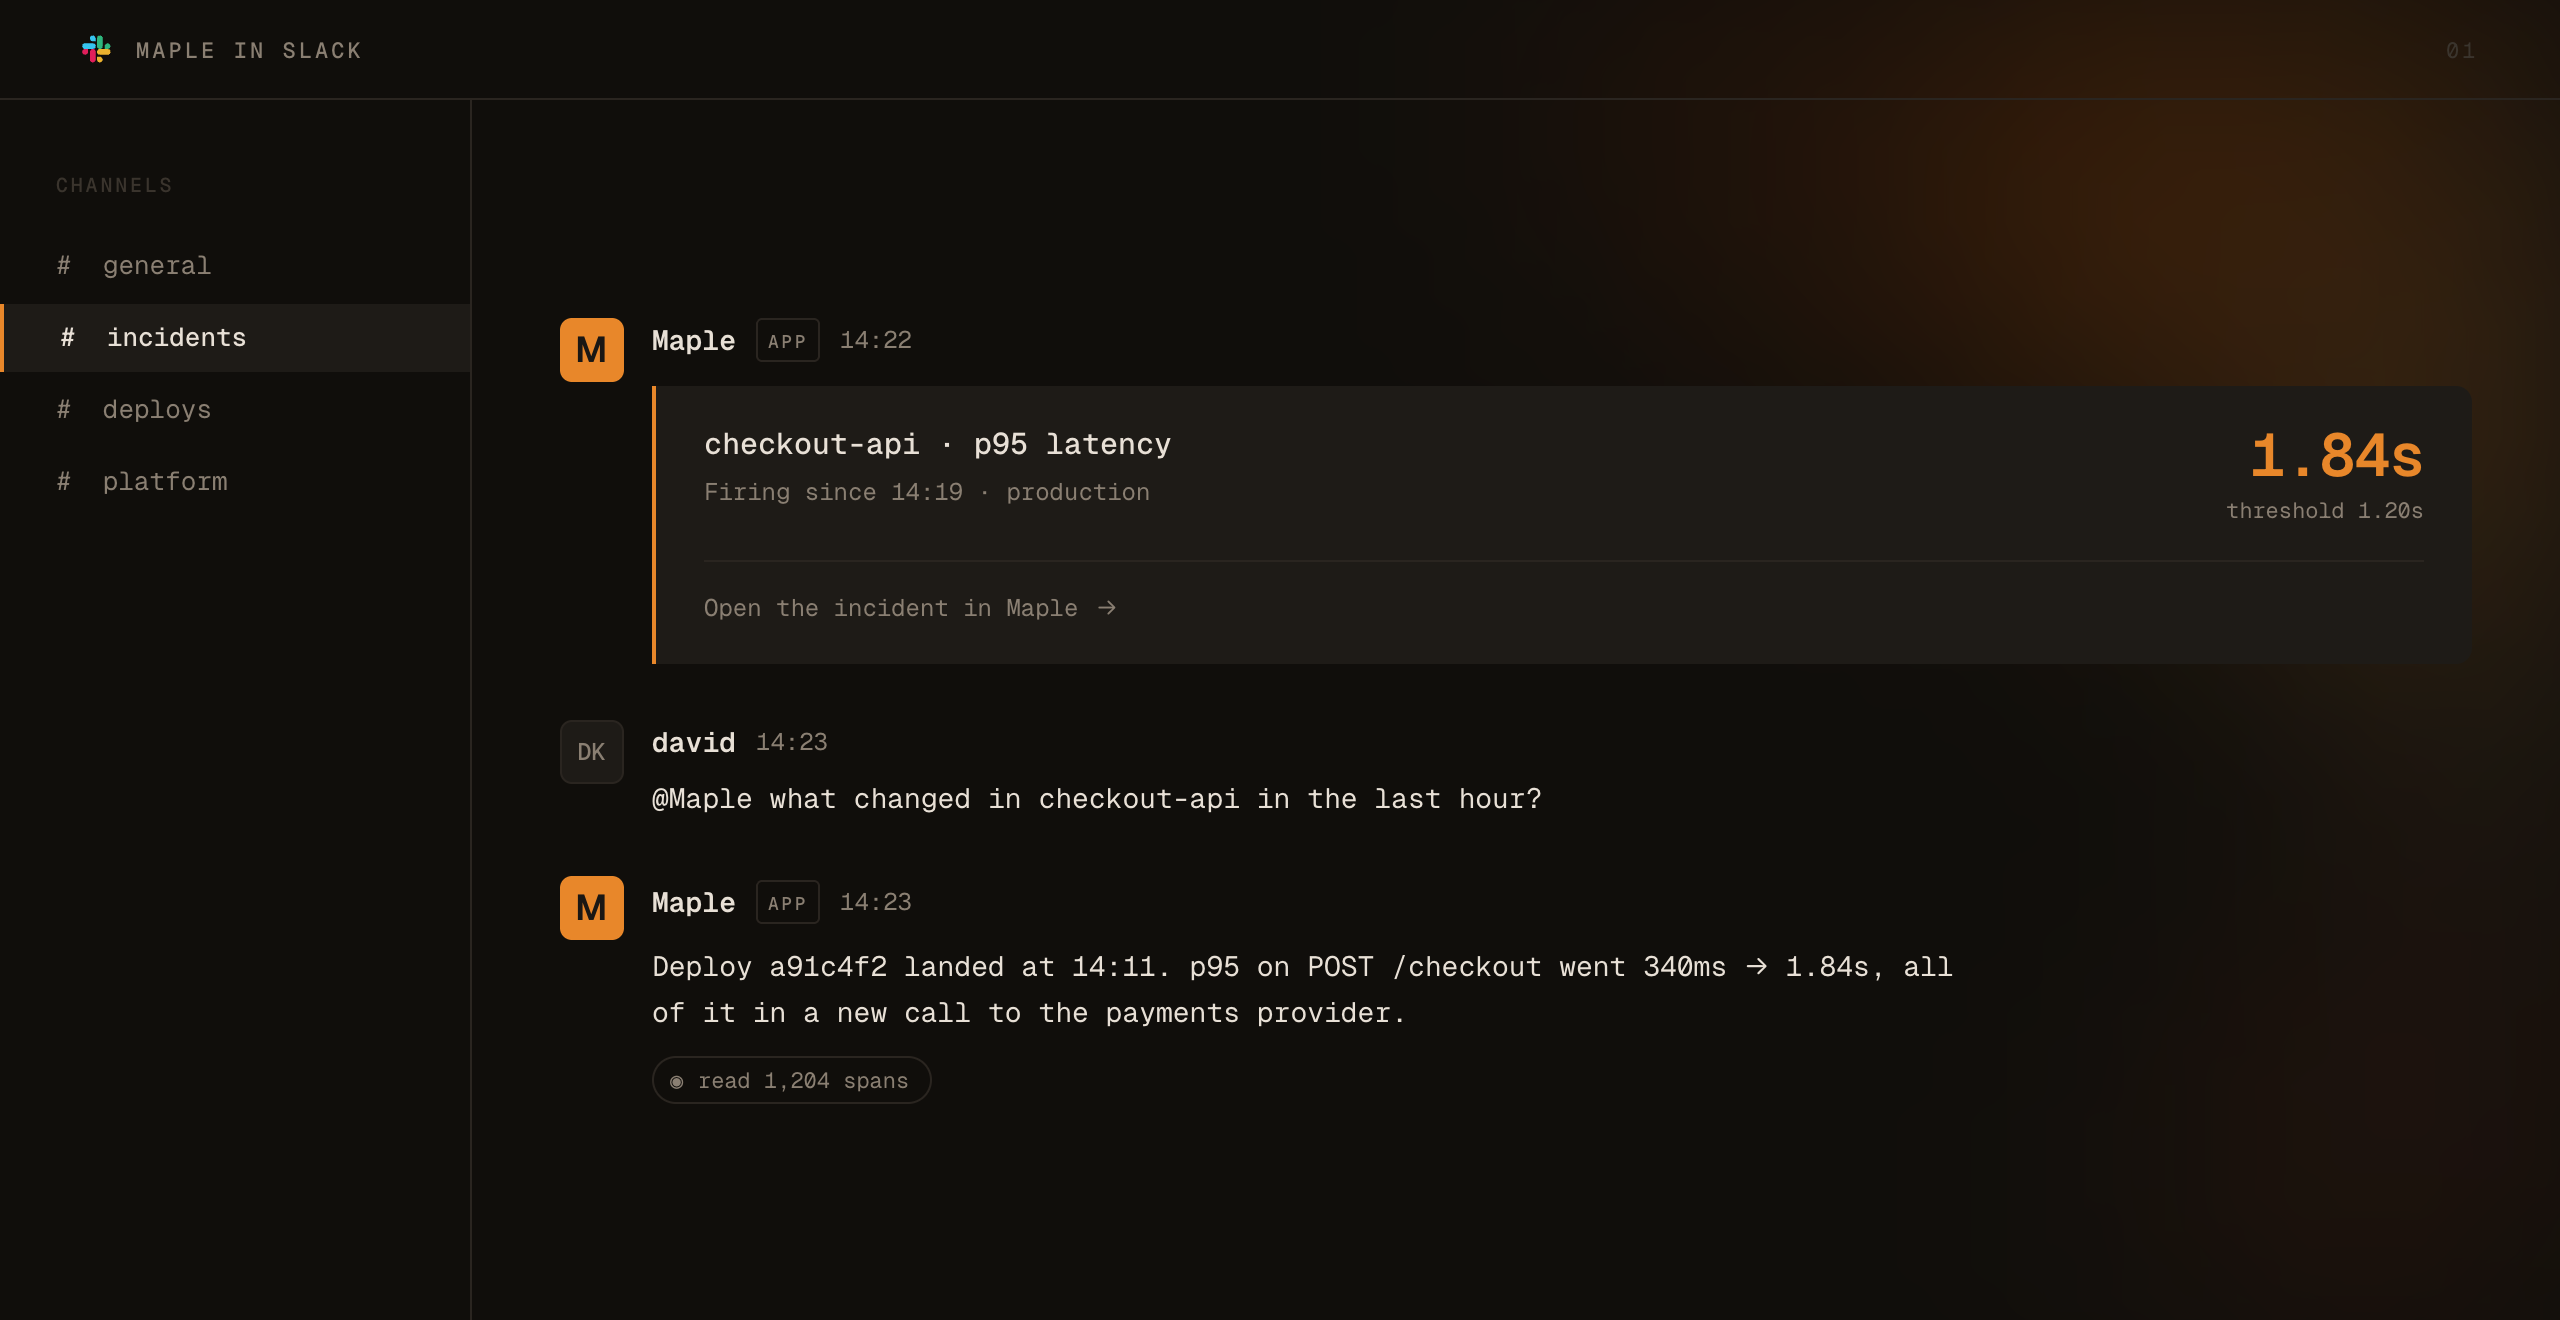
Install Maple into your Slack workspace from Integrations and you get two things.
Route any alert rule to a channel. Deliveries carry the rule, the triggering value, and a link into Maple.
Mention the bot to ask about services, errors, traces, or a live incident. It answers from your telemetry and posts its status as it works. Reconnecting to refresh permissions no longer means uninstalling first.
Alerts, rebuilt
Breaking. Alerts now run on one engine. On upgrade:
- Metric rules became query-builder drafts. Review them before re-enabling.
- Rules without a destination were disabled.
What’s new:
- The preview chart now comes from the evaluator that runs the rule — same windows, filters and reducers — so it matches the rule’s detail page. Raw SQL rules get one too.
- Failed evaluations record an error and write a check row, so gaps surface instead of going silent. Skipped checks, missing destinations and delivery failures all land in one place.
- Alerts opens on an overview: health, active incidents, activity.
- Email destinations, without wiring up a webhook.
- Anomaly detection is less trigger-happy, and traffic-outage false positives are down.
A public API
The v2 API is documented and stability-committed, with prefixed object IDs, cursor pagination, a consistent error envelope, and snake_case throughout. It covers API keys, dashboards, alert rules, destinations, incidents, error issues, telemetry queries, ingest keys, attribute mappings, scrape targets, and recommendations. Keys get scopes, expiry, and per-key rate limits, and there’s an API Reference tab in Settings.
On top of that:
@maple-dev/alchemy— declare dashboards, alert rules, destinations and API keys in youralchemy.run.tsand deploy them with the rest of your infrastructure.maple auth login— browser-based CLI login, credentials in your OS keychain.- MCP OAuth — connect Maple’s MCP server from any standards-compliant client. Standard API keys work against MCP, members can create MCP keys, and setup is one click from Connect.
PlanetScale

Connect your org with a service token and Maple collects branch metrics automatically — no scrape target to configure. Databases and branches show up as inventory, and the service map now draws the PlanetScale database behind Hyperdrive instead of stopping at the proxy.
Spend limits

Billing is spend-first: what you’re spending, what’s driving it, and where it’s heading, with an estimated cost breakdown by signal and in-app invoices.
Set a spend limit and Maple stops accepting data past it rather than surprising you at the end of the month. Session recordings are metered and size-capped.
Investigations

Issues, investigations and escalations are one workflow now: issue → thread → evidence-backed diagnosis → approved action → escalation audit.
Investigations can read your source code, so findings point at real lines. The workspace renders structured tool output instead of raw JSON and survives a reload. Escalation policies run on one shared engine, with a simulator in settings.
Explore
The four signals — traces, logs, metrics and replays — now live together under Explore.
- Every service keeps the same color across charts, traces and the service map.
- Trace timeline rework: zoom is clamped to the viewport and hover is much faster.
- Duration filtering is anchored in your real distribution, with p50/p95 presets.
- Latency percentiles are colored by magnitude. Syntax highlighting in the advanced filter editor.
- Traces works on every screen size.
- Replays got a player-first layout with a lane-aligned session list.
- Service map: database nodes split by identity, Hyperdrive collapses, an environment switcher, Cloudflare zones and Workers as nodes, and no layout shift while it loads.
- The metrics explorer is a browse grid with shareable metric detail pages, and attribute suggestions are scoped to the selected metric.
Dashboards
- Templates split into Ready for your data and Needs setup, and the ones that need setup say
what’s missing (
no k8s.pod.*) instead of dimming. - Chart types are unified between raw-SQL and query-builder widgets.
- Better default heights, a real loading screen, and a rebuilt list view.
- Fixed: stacked areas outlining the whole stack; the “Update failed” banner latching on.
Setup and integrations
- Setup audit now runs 41 checks across ingestion, attributes and instrumentation.
- Cloudflare connects over OAuth and provisions its datasets for you, with an infrastructure page and zone analytics filterable by path, country and client.
- Ingestion settings rebuilt around one endpoint-and-keys card. API keys get masked reveal, and scopes and expiry at creation.
- Integrations list, empty states and drill-ins redesigned. Kubernetes and host filters run instantly.
- Local mode gained metrics, services and errors views plus telemetry archives.
- A global chat slide-over replaced the sidebar entry — open it anywhere with
C.
Fixes
- Fixed the main-thread freezes and tab crashes on data-heavy pages, and added guardrails.
- Rerender cascades removed; skeleton and page transitions moved off the main thread.
- Trace and dashboard loads are faster, and wide time ranges hit new search indexes.
- Transient “Cannot reach Maple API” errors retry themselves.
- Hard-refreshing a deep link no longer bounces you home.
- Silent data-fetch failures now surface as a retryable error state; crashes show a branded screen.
- Fixed duplicate notification emails, broken session playback, and timezone jumps on custom ranges.
SDKs
Session replay is built into the Effect SDK — you no longer need the separate browser package to
record sessions (@maple-dev/effect-sdk 0.6.0, @maple-dev/browser 0.2.0).